1. どんなもの?
最近モナコインのマイニングを始めたのですが、採掘状況確認のため毎回VIP Poolのサイトを覗くのがメンドクサイので、Androidのウィジェットで手軽に状況を確認できるシステムを構築してみました。
ハッシュレートが何らかの方法で取得できるなら、ちょっと書き換えるだけで、モナコインの別のプールや、ビットコイン・イーサリアム等でも使えるかも。
2. 概略図
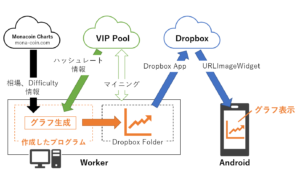
(1) モナコインをマイニングしているワーカ上(ワーカじゃなくても常時起動しているPCなら何でもOK)で、今回のプログラムを起動
(2) VIP PoolのAPIを叩いてハッシュレート情報を取得、Monacoin Charts (mona-coin.com) から相場情報とDifficulty情報を取得
(3) グラフを描画しDropboxフォルダに保存
(4) Dropboxアプリがネット上のDropboxと自動同期
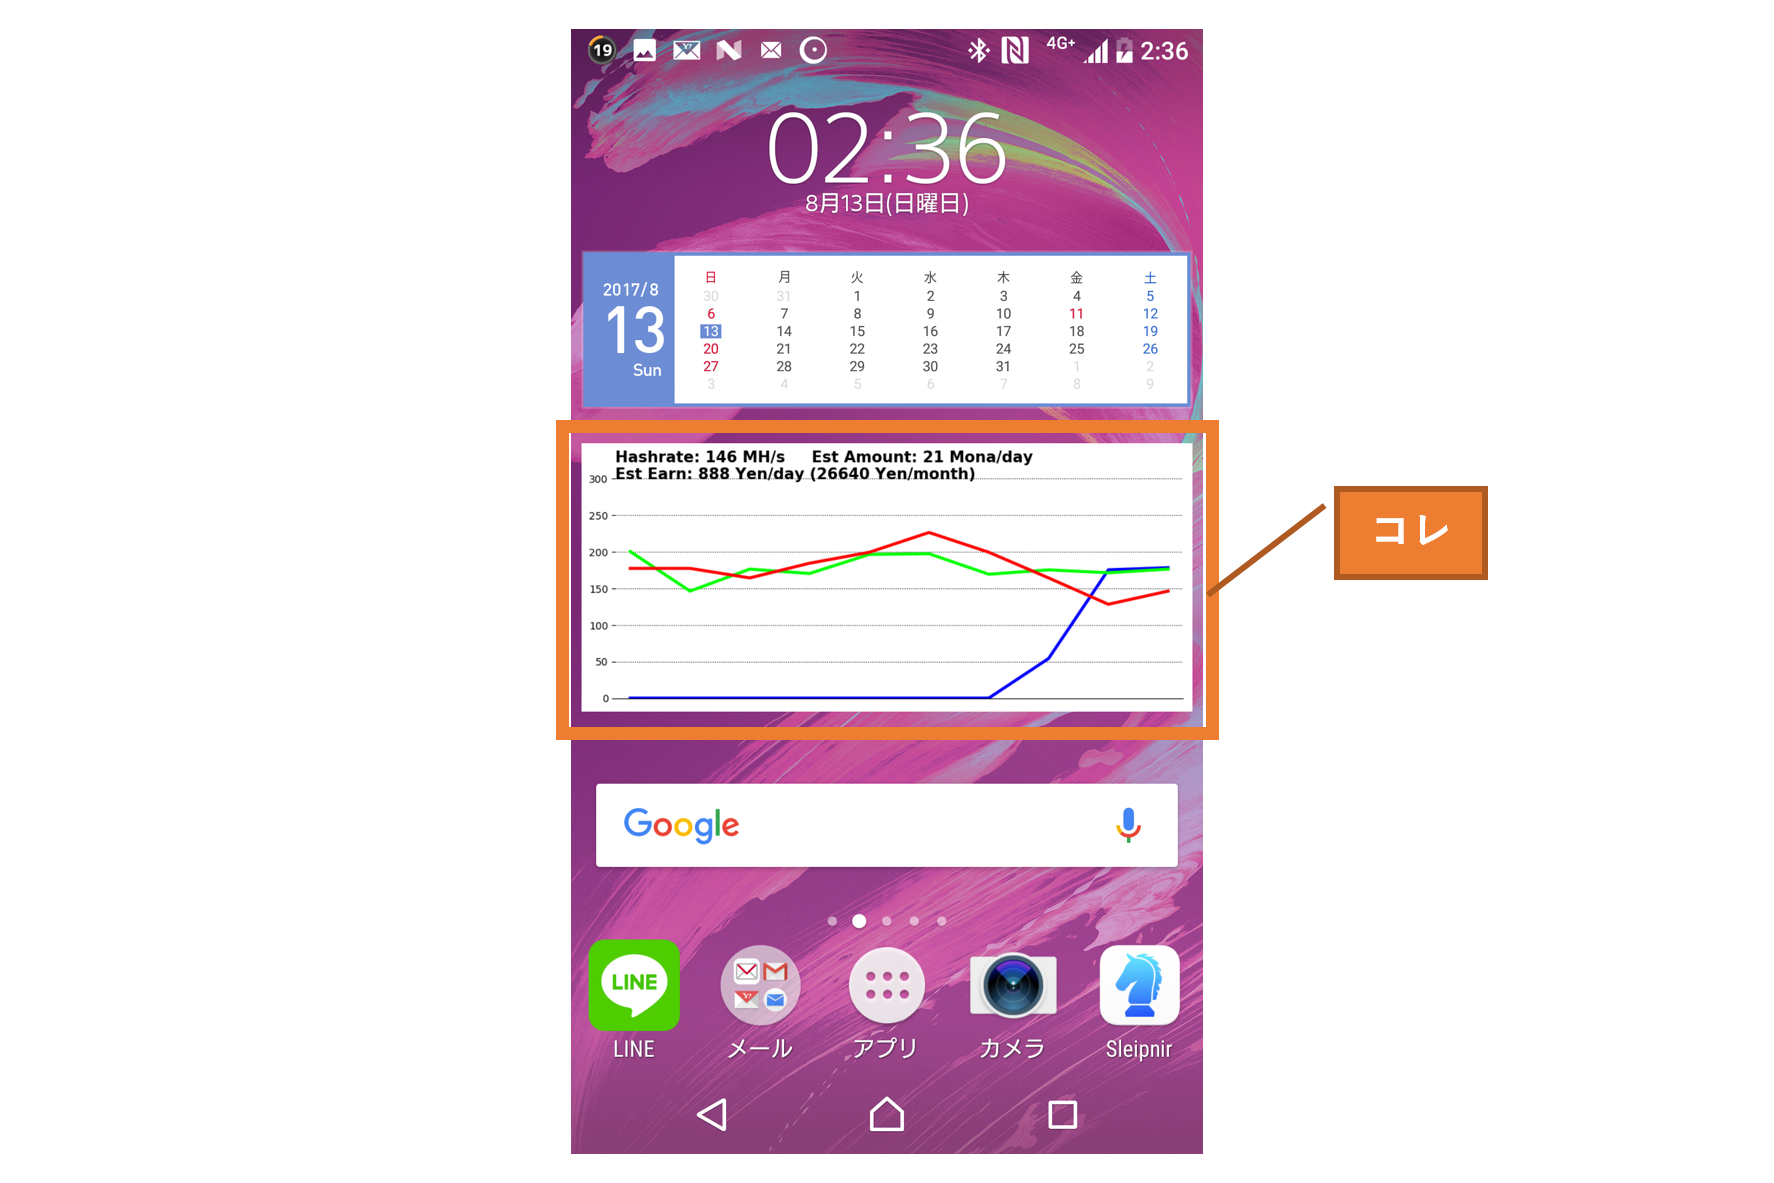
(5) スマホの”URLImageWidget”でDropbox上のグラフ画像をホーム画面に表示
3. 準備
3-1. スマホに”URLImageWidget”をインストール
https://play.google.com/store/apps/details?id=com.weite_welt.urlimagewidget&hl=ja
3-2. ワーカ上に”matplotlib”をインストール
3-3. ワーカ上に”beautifulsoup”をインストール
3-4. VIP PoolのAPIキーを確認
VIP Pool: アカウント > アカウント編集 > アカウント詳細 > APIキー(英数字の文字列)をメモ
4. ワーカ上で動かすプログラム
以下に記載のプログラムを動かすとプログラムと同一フォルダに、下のような画像ファイル(hashrate.png)が、1分周期で生成され続けます。
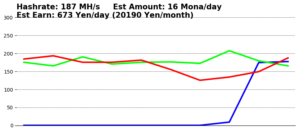
Hashrate: 現在のハッシュレート
Est Amount: 一日当たりのモナコイン予想採掘量
Est Earn: 一日(一月=一日×30)当たりの円換算での予想利益
赤プロット: 最近10分のハッシュレートの1分ごとの値
緑プロット: 最近100分のハッシュレートの10分ごとの平均値
青プロット: 最近1000分のハッシュレートの100分ごとの平均値
以下プログラムを適当な名前(MonaGraph.pyなど)で、ワーカ上のDropboxフォルダ内に保存してください。
※14行目のapiKeyに 3-4 でメモしたAPIキーを記載してください
# -*- coding: utf-8 -*-

import matplotlib.pyplot as plt
import matplotlib.dates as mdates
import json, urllib2
from datetime import datetime, timedelta
import time
import os
import urllib2
from bs4 import BeautifulSoup
import re
import math

apiKey = 'API Key'
userStatusUrl = 'https://vippool.net/index.php?page=api&action=getuserstatus&api_key='+apiKey
monaInfoUrl = 'http://mona-coin.com'

amountPerBlock = 25

dataNumner = 1000
hashrates = [0]*dataNumner

while True:
	try:
		r = urllib2.urlopen(userStatusUrl)
		root = json.loads(r.read())
		status = root['getuserstatus']
		data = status['data']
		hashrate = int(data['hashrate']/1000)
	except ValueError:
		hashrate = 0
	finally:
		r.close()

	hashrates.pop(0)
	hashrates.append(hashrate)

	try:
		html = urllib2.urlopen(monaInfoUrl).read()
		soup = BeautifulSoup(html)
		priceTable = soup.find(class_='col-lg-6').find(class_='panel panel-info').find(class_='table table-bordered')
		priceTableColumn = priceTable.findAll('tr')[1]
		priceStr = priceTableColumn.findAll('td')[1].string
		priceMatch = re.search(r'(\d+.\d+)',priceStr)
		price = float(priceMatch.group(1))
		print price

		difficultyTable = soup.find(class_='col-lg-3').find(class_='panel panel-success').find(class_='table table-bordered')
		difficultyTableColumn = difficultyTable.findAll('tr')[1]
		difficultyStr = difficultyTableColumn.findAll('td')[2].string
		difficultyMatch = re.search(r'(\d+,\d+)',difficultyStr)
		difficulty = int(difficultyMatch.group(1).replace(',',''))
		print difficulty
	except ValueError:
		price = 0
		difficulty = 1
	finally:
		r.close()

	hashratesAve10=[0]*10
	for i in range(0,10):
		hashratesAve10[i] = sum(hashrates[(dataNumner-100+i*10):(dataNumner-100+i*10+10)])/10

	hashratesAve100=[0]*10
	for i in range(0,10):
		hashratesAve100[i] = sum(hashrates[i*100:i*100+100])/100

	print hashrates[-10:]
	print hashratesAve10
	print hashratesAve100

	plt.close()
	plt.figure(figsize = (10, 4), facecolor='#57b9d6')
	#plt.axes(axisbg='#57b9d6')

	plt.plot(range(0,10),hashratesAve100, color='#0000ff',linewidth=3)
	plt.plot(range(0,10),hashratesAve10, color='#00ff00',linewidth=3)
	plt.plot(range(0,10),hashrates[-10:], color='#ff0000',linewidth=3)

	hashrateAveOfNonZero = sum(hashrates)/(len(hashrates)-hashrates.count(0))
	estAmountPerDay = int(amountPerBlock*hashrateAveOfNonZero*math.pow(10,6)*3600*24/(difficulty*math.pow(2,32)))
	estEarnPerDay = int(estAmountPerDay*price)
	estEarnPerMonth = int(estEarnPerDay*30)
	displayInfo = 'Hashrate: '+str(hashrates[-1])+' MH/s     Est Amount: '+str(estAmountPerDay)+' Mona/day\nEst Earn: '+str(estEarnPerDay)+' Yen/day ('+str(estEarnPerMonth)+' Yen/month)'
	plt.title(displayInfo,loc='left',fontsize=15, horizontalalignment='left',verticalalignment='center',color='#000000',weight='bold')

	plt.yticks( range(0,10000,50) )
	plt.xlim(-0.25, 9.25)
	plt.ylim(0, max(hashrates)*1.125)

	plt.gca().spines['right'].set_visible(False)
	plt.gca().spines['top'].set_visible(False)
	plt.gca().spines['left'].set_visible(False)
	#plt.gca().spines['bottom'].set_visible(False)
	plt.gca().yaxis.set_ticks_position('left')
	plt.gca().xaxis.set_ticks_position('none')
	plt.gca().set_xticklabels([])
	#plt.gca().set_yticklabels([])
	#plt.grid(which='major',color='black',linestyle=':')
	plt.gca().yaxis.grid(True,which='major',color='black',linestyle=':')

	plt.savefig(os.path.abspath(os.path.dirname(__file__))+'\\hashrate.png', bbox_inches="tight", pad_inches=0.1)

	plt.cla()
	plt.clf()

	time.sleep(60)
5. Dropbox上のファイルの直接リンク取得
4.のプログラムを動かすと、プログラムと同一フォルダ(Dropboxフォルダ内)にグラフの画像ファイルが生成されるので、このファイルに直接アクセスできるリンクを取得します。
Dropboxでただリンクを生成しただけでは直接リンクとはならずDropboxサイトに飛んでしまうので、取得したリンクを少し書き換えます。
https://www.dropbox.com/s/[英数字文字列]/[ファイル名.拡張子]?dl=0
となっているのを、
https://dl.dropboxusercontent.com/s/[英数字文字列]/[ファイル名.拡張子]
に書き換えると直接リンクになります。
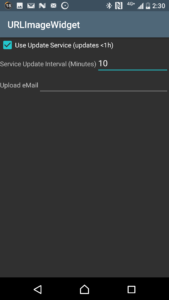
6. “URLImageWidget”の設定
ホーム画面にウィジェットを追加して設定します。
URLには、5.で取得したグラフ画像のURLを記載。
Update周期はお好みで設定して、「CLOSE」で設定保存。
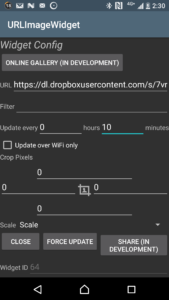
Update周期を1時間以下にした場合、Global Configも設定しないといけないみたいです。


コメント